
What is Deliverable Quantity?
Introduction
Deliverable quantity is a very important indicator that traders use for evaluating the investor’s interest in a stock. Let’s try to understand what deliverable quantity is and how to analyze it to spot better trading opportunities.
Meaning of “taking delivery”
There are two types of trades : intraday and delivery.
Intraday trades are taken with the intention of making money within the same trading session. It means that buying and selling happens the same day and no position is carried overnight.
Delivery trades are taken with the intention of holding the position for more than a day. It can be a couple of days, a few months or even years. By taking the delivery of the shares, the delivery based traders (swing, positional or portfolio) show their commitment and optimism about the stock’s near term performance.
What is deliverable quantity?
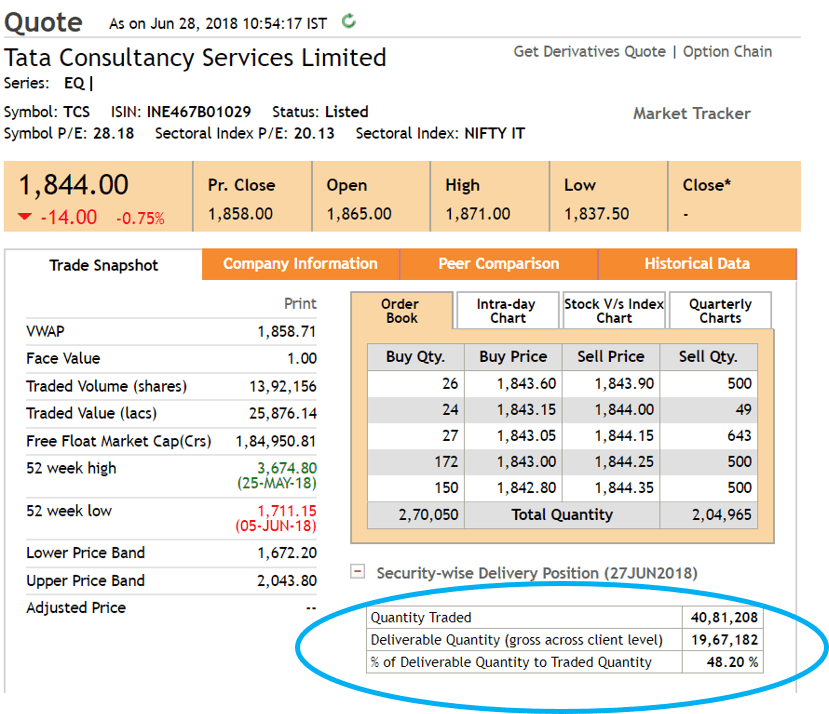
Deliverable quantity is the total number of shares that were marked for delivery on a certain date. You can easily find these stats on the websites of BSE and NSE. Here’s a quick example of TCS. On 28th of June, a total of 40,81,208 shares were traded on NSE, out of which 19,67,182 shares were accepted for delivery by the traders (for swing trading, positional trading or portfolio).
Traded Quantity (i.e. total shares traded) = 40,81,208
Deliverable Quantity (i.e. shares accepted for delivery) = 19,67,182
The Art of Analyzing Delivery Percentage
Delivery percentage is calculated by dividing the Deliverable quantity by the quantity traded (in the case TCS, it was 48.2%). Sometimes, delivery percentage is a better stat to look at than deliverable quantity because the absolute number of deliverable shares may not mean much.

By comparing a trend on deliverable percentage, traders sometime try to spot the stocks that are generating increased investor interest.
Analyzing delivery% is more of an art than science.
You need to spot a clear shift in the numbers over time. For example, if a stock with an average delivery of 10% starts seeing the numbers go up to 70-80% , it would mean that something is fundamentally changing in the company. Beware of drawing such conclusions based on small timeframes though. You need the trend to sustain for at least a couple of months.
Another way of using delivery % is to check their magnitude in stocks that are running with a high momentum. A low delivery % in such cases might mean that the rally is driven by traders (and not investors), in which case, a sharp reversal might be on the cards.
A similar tactic can be used for comparing stocks within a sector. Let’s say all the pharma stocks are running in the past few days and you need to know which ones will show continued momentum. If the delivery % of Dr. Reddy and Lupin happen to go above their regular value whereas that of Ajanta Pharma and Cipla are down, you can infer that better bets for going long would be the former.
Don’t make this a simplistic analysis though; delivery % in itself can tell very less. It is just another stat that you need to study along with several others in order to meaningfully understand the dynamics of the market and future opportunities.

Howdy!
If you’re here for the first time, let’s get introduced.
VRD Nation is India’s premier stock market training institute and we (Team VRD Nation) are passionate about teaching each and every aspect of investing and trading.
If you’re here for the first time, don’t forget to check out “Free Training” section where we have tons of free videos and articles to kick start your stock market journey.
Also, we got two awesome YouTube channels where you can continue the learning process.
Must-Read Articles


How to Recover from a Big Trading Loss?

Secret Weapons of Professional Traders

7 Habits of Highly Effective Traders

7 Reasons Why Traders Love Options

The Biggest Lie About Intraday Trading

Top 5 Books on Technical Analysis
What is Deliverable Quantity?
Introduction
Deliverable quantity is a very important indicator that traders use for evaluating the investor’s interest in a stock. Let’s try to understand what deliverable quantity is and how to analyze it to spot better trading opportunities.
Meaning of “taking delivery”
There are two types of trades : intraday and delivery.
Intraday trades are taken with the intention of making money within the same trading session. It means that buying and selling happens the same day and no position is carried overnight.
Delivery trades are taken with the intention of holding the position for more than a day. It can be a couple of days, a few months or even years. By taking the delivery of the shares, the delivery based traders (swing, positional or portfolio) show their commitment and optimism about the stock’s near term performance.
What is deliverable quantity?
Deliverable quantity is the total number of shares that were marked for delivery on a certain date. You can easily find these stats on the websites of BSE and NSE. Here’s a quick example of TCS. On 28th of June, a total of 40,81,208 shares were traded on NSE, out of which 19,67,182 shares were accepted for delivery by the traders (for swing trading, positional trading or portfolio).
Traded Quantity (i.e. total shares traded) = 40,81,208
Deliverable Quantity (i.e. shares accepted for delivery) = 19,67,182
The Art of Analyzing Delivery Percentage
Delivery percentage is calculated by dividing the Deliverable quantity by the quantity traded (in the case TCS, it was 48.2%). Sometimes, delivery percentage is a better stat to look at than deliverable quantity because the absolute number of deliverable shares may not mean much.
By comparing a trend on deliverable percentage, traders sometime try to spot the stocks that are generating increased investor interest.
Analyzing delivery% is more of an art than science.
You need to spot a clear shift in the numbers over time. For example, if a stock with an average delivery of 10% starts seeing the numbers go up to 70-80% , it would mean that something is fundamentally changing in the company. Beware of drawing such conclusions based on small timeframes though. You need the trend to sustain for at least a couple of months.
Another way of using delivery % is to check their magnitude in stocks that are running with a high momentum. A low delivery % in such cases might mean that the rally is driven by traders (and not investors), in which case, a sharp reversal might be on the cards.
A similar tactic can be used for comparing stocks within a sector. Let’s say all the pharma stocks are running in the past few days and you need to know which ones will show continued momentum. If the delivery % of Dr. Reddy and Lupin happen to go above their regular value whereas that of Ajanta Pharma and Cipla are down, you can infer that better bets for going long would be the former.
Don’t make this a simplistic analysis though; delivery % in itself can tell very less. It is just another stat that you need to study along with several others in order to meaningfully understand the dynamics of the market and future opportunities.


![What is Virtual Contract Note [Zerodha]](https://www.vrdnation.com/wp-content/uploads/2023/10/maxresdefault-virtual-note-500x383.jpg)


Hello Sir / madam,
I’m interested to learn share market from basics. I’m graduated in BCA from Gujarat University, Vadodara, Gujarat.
Will you guide me about education of share market?
I’ll wait for your response.
Sure, please explore the courses on the website and if you have any questions, reach out on WhatsApp numbers:
Phone +91-7331111326
Phone +91-6281316743
what indicates rising in delivery percentage with decreasing price in stock which is not in F&O? strength or weakness.