
Dark Cloud Cover
Introduction
Traders were first introduced to candlestick patterns in the 80s. Since then, they have become one of the most widely used tools in technical analysis.
There are several candlesticks to choose from depending upon the pattern formed on the price chart.
One such candlestick pattern is the Dark Cloud Cover. Let’s dive deeper and understand this pattern in more detail.
What is a Dark Cloud Cover?
Dark Cloud Cover is a two-candle bearish reversal pattern that is formed after an uptrend.

The term dark cloud resembles the falling prices of an asset.
This pattern signals that the market is heading from an uptrend to a downtrend.
The accuracy of this pattern is determined by the volume of the candles.
If the second candle is long, the pattern will be more significant as it confirms that bears are aggressively selling and moving the market towards a downtrend.
The pattern will be insignificant if the candles formed are short or uneven.
How to identify a Dark Cloud Cover pattern?
The following conditions should be satisfied for the formation of this pattern:
- The first candle should be bullish.
- The second candle should be bearish and close below the midpoint of the first candle.
- There should be an uptrend prior to the formation of this pattern.
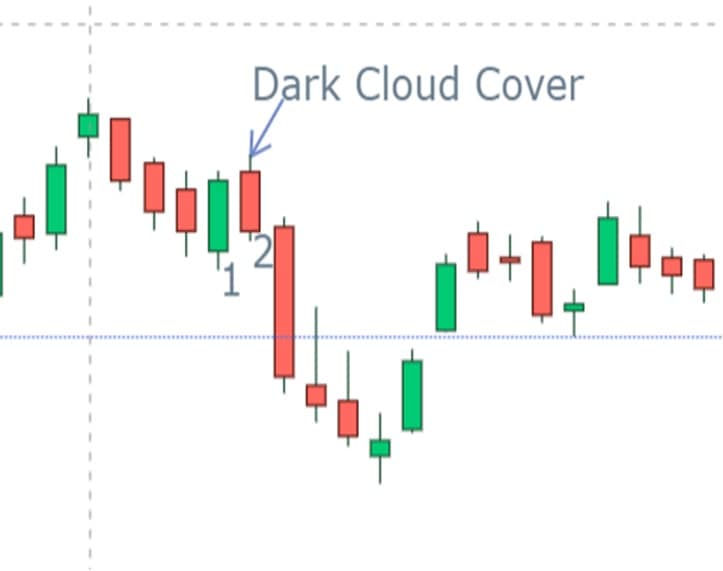
When the first candle is formed, we can see that the buying pressure is intense and the uptrend continues to push the market higher.
On the next day, however, there is the resistance between the buyers and sellers as the buyers begin to fear that prices have gone too high.
Later in the day, there is a strong selling pressure which pushes the prices downwards. This results in the formation of a red candle.
Trading Strategy for Dark Cloud Cover
Every trader knows that no trade should be placed based on only one pattern. Adding a filter or combining multiple patterns is necessary to improve the accuracy of the trade.
Dark cloud cover can be very tricky to trade. The formation of an up candle and then a down candle is not enough.
A trader should wait for the confirmation candle. A third bearish candle that closes below the previous candle will confirm that prices are going down.
Upon confirmation of the pattern, the trader can sell the stock or go short on his position.
However, whether the pattern will work or not will depend upon the market and the timeframe of the trade.
Conclusion
Like other candlestick patterns, the Dark cloud cover is a useful trading tool that assists traders in analyzing the market.
This pattern provides useful information such as the best time to close a position or go short on stock.
However, other technical indicators and filters are necessary to make the pattern more effective.
When trading this pattern, it is advisable to place stop loss orders so that losses can be minimized if the prices move in the opposite direction.

Howdy!
If you’re here for the first time, let’s get introduced.
VRD Nation is India’s premier stock market training institute and we (Team VRD Nation) are passionate about teaching each and every aspect of investing and trading.
If you’re here for the first time, don’t forget to check out “Free Training” section where we have tons of free videos and articles to kick start your stock market journey.
Also, we got two awesome YouTube channels where you can continue the learning process.
Must-Read Articles


How to Recover from a Big Trading Loss?

Secret Weapons of Professional Traders

7 Habits of Highly Effective Traders
7 Reasons Why Traders Love Options

The Biggest Lie About Intraday Trading

Top 5 Books on Technical Analysis
Dark Cloud Cover
Introduction
Traders were first introduced to candlestick patterns in the 80s. Since then, they have become one of the most widely used tools in technical analysis.
There are several candlesticks to choose from depending upon the pattern formed on the price chart.
One such candlestick pattern is the Dark Cloud Cover. Let’s dive deeper and understand this pattern in more detail.
What is a Dark Cloud Cover?
Dark Cloud Cover is a two-candle bearish reversal pattern that is formed after an uptrend.
The term dark cloud resembles the falling prices of an asset.
This pattern signals that the market is heading from an uptrend to a downtrend.
The accuracy of this pattern is determined by the volume of the candles.
If the second candle is long, the pattern will be more significant as it confirms that bears are aggressively selling and moving the market towards a downtrend.
The pattern will be insignificant if the candles formed are short or uneven.
How to identify a Dark Cloud Cover pattern?
The following conditions should be satisfied for the formation of this pattern:
- The first candle should be bullish.
- The second candle should be bearish and close below the midpoint of the first candle.
- There should be an uptrend prior to the formation of this pattern.
When the first candle is formed, we can see that the buying pressure is intense and the uptrend continues to push the market higher.
On the next day, however, there is the resistance between the buyers and sellers as the buyers begin to fear that prices have gone too high.
Later in the day, there is a strong selling pressure which pushes the prices downwards. This results in the formation of a red candle.
Trading Strategy for Dark Cloud Cover
Every trader knows that no trade should be placed based on only one pattern. Adding a filter or combining multiple patterns is necessary to improve the accuracy of the trade.
Dark cloud cover can be very tricky to trade. The formation of an up candle and then a down candle is not enough.
A trader should wait for the confirmation candle. A third bearish candle that closes below the previous candle will confirm that prices are going down.
Upon confirmation of the pattern, the trader can sell the stock or go short on his position.
However, whether the pattern will work or not will depend upon the market and the timeframe of the trade.
Conclusion
Like other candlestick patterns, the Dark cloud cover is a useful trading tool that assists traders in analyzing the market.
This pattern provides useful information such as the best time to close a position or go short on stock.
However, other technical indicators and filters are necessary to make the pattern more effective.
When trading this pattern, it is advisable to place stop loss orders so that losses can be minimized if the prices move in the opposite direction.


Leave A Comment