
Hanging Man
Introduction
If you have been actively trading in the stock market for a while, you’ve probably heard of candlestick patterns.
These patterns are an essential part of any trader’s strategy. It is important to understand various types of candlestick patterns that are used to predict future price movements in the market.
One of the widely used candlestick patterns is the “Hanging Man”. Let’s see how it works and how traders use it in their strategy.
What is Hanging Man?
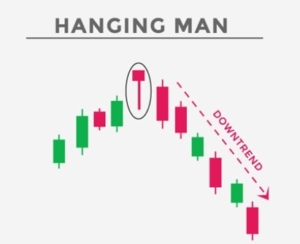
It is a single Japanese candlestick pattern appearing when a stock is in an uptrend. This pattern indicates a strong trend reversal i.e., from uptrend to downtrend.
Hanging Man patterns act as a warning of potential price change but not as a signal to sell.
It is formed after prices have been moving upwards for at least a few candlesticks. It looks similar to the “T” alphabet.
This pattern indicates that bulls have lost their strength to push the price upwards and bears have taken over the market.
How to identify the “Hanging Man” pattern?
This pattern appears after the stock has been rising for a while. The color of the candle could be either red or green.
If the price closes below the opening price, the candle turns red. This is a strong bearish sign.
If the price closes above the opening price, the candle turns green. This is still a bearish sign although not as strong as when the candle is red.
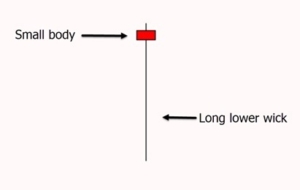
The pattern should have a small body indicating a minimal difference between the opening and closing price.
The upper wick is either absent or very small. The lower wick should be twice the length of the body or more than that.
The longer the lower wick, the more bearish is the signal because it indicates that the price has touched new lows during the day before bouncing back.
Trading Strategy for “Hanging Man” pattern
A trader should wait for the formation of the next candle before entering into a trade. If the next candle is red and the price falls below the previous day, it confirms the formation of the “Hanging Man” pattern.
If the candle of the next day is green, it means the pattern has failed. In this case, the trader should avoid shorting the market.
It is important to note that this pattern alone should not be taken as a sign to short the market. Other technical indicators such as confirmation candles and support levels should be used to confirm sell signals.
Conclusion
Although candlestick patterns are very useful in identifying trends and predicting future price movements, they suffer from serious limitations.
Sometimes waiting for the confirmation candle can result in the wrong entry point which may no longer justify the profit from the trade.
There is also no guarantee that prices will fall after the formation of the hanging man pattern and confirmation candle.
However, it would be wrong to deny the benefits of using candlestick patterns, especially the “Hanging Man” pattern which helps a trader in planning his exit strategy from an asset.

Howdy!
If you’re here for the first time, let’s get introduced.
VRD Nation is India’s premier stock market training institute and we (Team VRD Nation) are passionate about teaching each and every aspect of investing and trading.
If you’re here for the first time, don’t forget to check out “Free Training” section where we have tons of free videos and articles to kick start your stock market journey.
Also, we got two awesome YouTube channels where you can continue the learning process.
Must-Read Articles


How to Recover from a Big Trading Loss?

Secret Weapons of Professional Traders

7 Habits of Highly Effective Traders
7 Reasons Why Traders Love Options

The Biggest Lie About Intraday Trading

Top 5 Books on Technical Analysis
Hanging Man
Introduction
If you have been actively trading in the stock market for a while, you’ve probably heard of candlestick patterns.
These patterns are an essential part of any trader’s strategy. It is important to understand various types of candlestick patterns that are used to predict future price movements in the market.
One of the widely used candlestick patterns is the “Hanging Man”. Let’s see how it works and how traders use it in their strategy.
What is Hanging Man?
It is a single Japanese candlestick pattern appearing when a stock is in an uptrend. This pattern indicates a strong trend reversal i.e., from uptrend to downtrend.
Hanging Man patterns act as a warning of potential price change but not as a signal to sell.
It is formed after prices have been moving upwards for at least a few candlesticks. It looks similar to the “T” alphabet.
This pattern indicates that bulls have lost their strength to push the price upwards and bears have taken over the market.
How to identify the “Hanging Man” pattern?
This pattern appears after the stock has been rising for a while. The color of the candle could be either red or green.
If the price closes below the opening price, the candle turns red. This is a strong bearish sign.
If the price closes above the opening price, the candle turns green. This is still a bearish sign although not as strong as when the candle is red.
The pattern should have a small body indicating a minimal difference between the opening and closing price.
The upper wick is either absent or very small. The lower wick should be twice the length of the body or more than that.
The longer the lower wick, the more bearish is the signal because it indicates that the price has touched new lows during the day before bouncing back.
Trading Strategy for “Hanging Man” pattern
A trader should wait for the formation of the next candle before entering into a trade. If the next candle is red and the price falls below the previous day, it confirms the formation of the “Hanging Man” pattern.
If the candle of the next day is green, it means the pattern has failed. In this case, the trader should avoid shorting the market.
It is important to note that this pattern alone should not be taken as a sign to short the market. Other technical indicators such as confirmation candles and support levels should be used to confirm sell signals.
Conclusion
Although candlestick patterns are very useful in identifying trends and predicting future price movements, they suffer from serious limitations.
Sometimes waiting for the confirmation candle can result in the wrong entry point which may no longer justify the profit from the trade.
There is also no guarantee that prices will fall after the formation of the hanging man pattern and confirmation candle.
However, it would be wrong to deny the benefits of using candlestick patterns, especially the “Hanging Man” pattern which helps a trader in planning his exit strategy from an asset.


Leave A Comment